The adoption of Kubernetes as the standard orchestrator, and of managed offerings such as Amazon EKS in particular, promises agility and scalability. Without strategic resource governance, however, automation can create a paradox: higher operational efficiency alongside runaway costs. Through a case study, this article examines a common but critical challenge: resource overallocation caused by dynamic provisioning systems such as Karpenter (karpenter.sh). Using a real case, we show how a methodical analysis, based on data collected with Prometheus and Grafana, and the implementation of policies such as LimitRange can not only correct course but turn the cluster into a highly optimized infrastructure, reducing waste and maximizing the return on cloud investment.
Initially, managing our EKS cluster posed significant challenges. One of the main problems was the inability to schedule new pods because of static, manual node sizing: the nodes quickly reached saturation. This approach, while simple, could not handle demand peaks or workload variations, leading to inefficiencies and operational blockages when the available resources were not enough for new application instances.
To overcome this limitation, we implemented Karpenter, a dynamic node provisioner, with the goal of allocating resources just in time. Karpenter did solve the pod scheduling problem, ensuring that nodes were always available when applications needed them. Its ability to react quickly to the cluster's needs markedly improved the system's responsiveness and the availability of our applications.
However, adopting Karpenter inadvertently introduced a new problem: excessive node allocation. We noticed that Karpenter tended to create a large number of nodes that, once the demand peak was over, often remained unused or underutilized. This was especially evident in scenarios where applications spent long periods idle, consuming little or no resources but still occupying entire nodes that could have been shut down or reused.
This resource overallocation had a direct impact on operating costs and on the overall efficiency of our EKS environment. Although scalability was ensured, the waste caused by idle nodes called for rethinking our resource management and cost optimization strategies within the cluster.
Context
The environment analyzed is a managed Kubernetes cluster hosted on AWS (Amazon EKS). The cluster was initially configured with a managed control plane and an initial node group of 3 medium-sized nodes (c5a.xlarge, 4 vCPUs and 8 GB of RAM). As the number of hosted applications grew, and with it the resources required, the node group was expanded manually to keep up with demand. Karpenter was later implemented to automate dynamic node provisioning, ensuring that workloads were never left waiting to be scheduled for lack of resources. Unfortunately, automatic scaling systems with very loose limits do not help contain the amount of resources used, and therefore make it harder to keep costs under control. Without close monitoring and corrective action, spending becomes difficult to contain.
The problem
As mentioned, introducing a just-in-time scaling system such as Karpenter made cost management considerably more complicated. To clarify, it is worth taking a step back to explain how Karpenter works and identify the reason for the cost increase.
When a new pod is requested in a Kubernetes cluster, it starts in the Pending state. It usually stays there only briefly. In a healthy cluster, the scheduler quickly identifies where to run the pod, which then moves to the next state, “Running”.
There are situations, however, in which this is not possible because the pod's requirements cannot be met, so it stays in the “Pending” state. Requirements can be of various kinds, such as access to resources (disks or special devices), anti-affinity rules, or a minimum amount of resources needed to run.
These are called “requests” and, together with “limits”, they define the vCPU/RAM that the pod needs (requests) or may use at most (limits).
When a pod defines “requests”, the scheduler must find a machine where those resources are available. Availability is checked by summing the “requests” of all running pods. For example, consider a node with 4 vCPUs and 8 GB of RAM running 10 pods, 8 of which have a CPU request of 0.25 vCPU. The scheduler calculates that a total of 2 vCPUs (8 × 0.25) is reserved and that another 2 vCPUs are available. If the pod to be scheduled has a CPU request of 2 or less, it will find room to run; otherwise the scheduler will look elsewhere. If no node is available, the pod stays “Pending”.
This is where Karpenter comes in: when it finds a pod “Pending” because of a resource shortage in the cluster, it provisions a new node suitable for the waiting workload, choosing among the instance types listed in its configuration.
Once the problem of pods stuck in Pending is solved, a new one appears: as long as there is a resource shortage, Karpenter keeps launching new nodes. The crucial question is: is the shortage real, or only perceived by the system? Does this definition of minimum required resources have any correlation with actual resource usage?
In short: no. Requests are usually omitted, since we are not particularly interested in setting a minimum to start the application. We are far more interested in setting a maximum on the resources a pod can use, to avoid saturating the node and degrading the performance of the other pods running on the same worker.
The Kubernetes documentation states:
"If you specify a limit for a resource, but do not specify any request, and no admission-time mechanism has applied a default request for that resource, then Kubernetes copies the limit you specified and uses it as the requested value for the resource."
As a result, a pod with a limit of 2 vCPUs and 4 GB of RAM is scheduled only if that entire amount of resources is available, because, without explicit requests, the two values are made equal.
So many pods end up running that do not actually need all the resources the scheduler thinks it must find, yet the way they are defined forces it to do so.
In our case, this was the main cause of the growth in cluster nodes (both those added manually to the node group and those added on the fly by Karpenter). Adding new pods caused a disproportionate increase in the workers the EKS cluster needed, with a direct impact on costs, since additional EC2 instances were being allocated and costs rose accordingly.
The objectives
To reduce these costs and the related waste, we set out to review all the resources requested by the pods, analyzing actual resource usage in depth, also to identify the best instance families for the cluster's workers and optimize usage and costs by selecting more suitable types. The analysis should therefore let us run the smallest possible number of workers while making the best use of the available resources.
The solution
1. Implementation and data collection
To carry out an in-depth, data-driven analysis, we installed kube-prometheus-stack in the Kubernetes clusters under study. This stack includes essential components such as Prometheus, for collecting detailed, continuous metrics, and Grafana, for visualizing and analyzing that data.
After installation, the system was left running for several weeks. This extended period allowed us to accumulate a significant, representative set of metrics on resource usage by pods and nodes. Extended data collection was crucial to capture long-term variations, load peaks, and periods of inactivity, providing a solid basis for the subsequent analysis.
1.1. Resource analysis with Prometheus and Grafana
Once the data had been collected, we analyzed it using the features of Prometheus and Grafana. This process involved several phases:
Phase 1 – Identifying pods with inadequate requests
We used PromQL (Prometheus Query Language) to query the metrics and identify pods with a significant gap between the resources requested (requests) and actual consumption (usage). Specific queries allowed us to highlight:
- pods with
requestsfar higher than their averageusage, indicating potential overallocation; - pods whose
usagefrequently exceeded theirrequests(and sometimes theirlimits), signaling undersizing that could lead to performance problems or outages.
Phase 2 – Verifying pods with incorrect resources
Using custom Grafana dashboards, we visualized the historical CPU and memory usage of individual pods and nodes. This allowed us to:
- confirm the anomalies identified with PromQL;
- visualize usage patterns over time, determining whether overallocation or undersizing was constant or tied to specific events.
Phase 3 – Applying LimitRange
To set default values and limits for resources in namespaces where requests had been omitted, we considered implementing LimitRange. This Kubernetes object makes it possible to:
- ensure that every pod has at least a defined resource request, preventing limits from being treated as requests and Karpenter from overallocating as a result;
- standardize resource configurations, making cluster management more predictable.
Phase 4 – Reviewing pods with startup problems
We analyzed the logs and metrics of pods that showed long startup times or recurring failures (CrashLoopBackOff), often caused by resource requests that were too tight. The goal was to:
- identify resource consumption spikes during startup that the initial requests did not adequately account for;
- adjust the requests of these pods to ensure a smoother, more stable startup without compromising overall efficiency.
Let's look in detail at each analysis step we carried out.
1.1.1. Identifying pods with inadequate requests and verifying pods with incorrect resources
The metrics analyzed were CPU and memory. We looked in our Prometheus instances for the most suitable metrics available and identified the following:
- node_namespace_pod_container:container_cpu_usage_seconds_total:sum_irate
- namespace_cpu:kube_pod_container_resource_requests:sum
- namespace_memory:kube_pod_container_resource_requests:sum
- container_memory_rss
The first three metrics are calculated through specific recording rules, available by default in a kube-prometheus-stack installation. These rules preprocess several other raw metrics, aggregating and transforming them into a more meaningful precalculated value that is ready to use. This approach improves the efficiency and clarity of the data, providing a concise yet accurate indication of complex parameters.
The last metric, on the other hand, is a native metric. It captures and directly shows the actual measurement of the resident memory used by each container. Unlike derived metrics, it offers a granular, unprocessed picture of resource consumption at container level, which is essential for detailed analysis and for identifying anomalies or inefficiencies in memory usage.
We then selected the namespaces that needed attention by running a query to find namespaces containing pods whose configured resources were oversized relative to actual usage. This does not necessarily indicate wasteful workloads, but it helps focus the investigation on the areas with the greatest optimization potential.
The PromQL queries used for CPU and RAM were the following:
RAM
The query selects the namespaces in which the ratio between actual RAM usage (the sum of container_memory_rss) and allocated resources (requests) is below 0.5. Such a low value indicates that less than half of the reserved memory is being used.
CPU
This query selected all namespaces where the sum of the actual CPU usage of all containers, divided by the sum of CPU requests, was below 0.1. Such a low value indicates very low CPU usage relative to what is reserved, suggesting a significant overestimate of the resources needed and, therefore, an optimization opportunity. Technically, CPU is the “scarcest” resource, but also the most used when an application is actually in use. It therefore needs to be addressed first.
Once the namespaces to work on had been identified, we analyzed the pods in each namespace one by one, checking their actual resource usage.
The default installation of the Prometheus monitoring stack already includes a dashboard that can help with the analysis by showing this data:
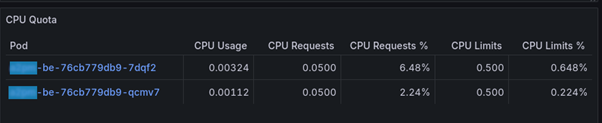
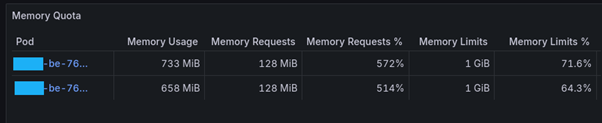
The metrics in these two tables make it possible to identify a workload that uses few resources compared with those reserved (CPU Requests % and Memory Requests %). If these values are too low, the values set for the various pods can be adjusted.
In the case shown, the minimum reserved CPU (requests) would be more than enough, but the value set (CPU Requests) is already very low (5% of a CPU, or 50m, in Kubernetes syntax, which uses “1m” to indicate 0.1% of a CPU and 1Mi for one mebibyte, roughly 1 MB, of memory), so it makes no sense to reduce it further at the risk of being unable to handle even minimal CPU spikes.
For memory, by contrast, the “Memory Requests %” value is very high, which means the configured parameter is not oversized relative to actual usage. This also means, however, that the “Memory Requests” value must be checked to make sure it is not too small; otherwise the application may fail to allocate all the resources it needs to start when the node is under load.
The case shown is therefore already optimized to reduce resource waste. In addition, the limits set appear to be more than sufficient for the application's current operation.
In any case, Grafana's time range selector can be used to retrieve metrics for a past period and verify the validity of the findings.
1.1.2. Applying LimitRange
The previous analysis revealed many pods with no Limit or Request values set. These pods are scheduled under the “BestEffort” QoS class. The kube-scheduler will find an available slot on any worker, even a minimal one, and schedule the pod there. On most of our workers, where the reserved CPU and RAM are never fully used, this scheduling will not cause many problems. Under heavy load, however, at critical times, pods could be scheduled on nodes that do not actually have the resources available for optimal execution.
To manage resources more effectively in these scenarios, where requests and limits are not explicitly defined at pod level, Kubernetes provides LimitRange.
GLOSSARY/HIGHLIGHTS
BestEffort
The Kubernetes QoS class assigned to pods with no requests or limits set. The key distinction is between requests (guaranteed resources) and limits (maximum cap): this is the technical core of the problem.
LimitRange
A Kubernetes policy that can be applied to a namespace to enforce constraints on CPU and memory resources. It allows you to:
- specify default requests and limits for pods, containers, and PersistentVolumeClaim objects when they are not explicitly defined;
- enforce minimum and maximum values for resource requests and limits;
- enforce a request-to-limit ratio for a resource.
Definition from the official Kubernetes documentation
A LimitRange provides constraints that can:
- Enforce minimum and maximum amount of compute resources to a Pod or Container in a namespace.
- Enforce minimum and maximum storage request size for a PersistentVolumeClaim in a namespace.
- Enforce a ratio between request and limit for a resource in a namespace.
- Set default request/limit values for compute resources in a namespace if none are specified.
As this shows, LimitRange is crucial to prevent uncontrolled “BestEffort” scheduling and to ensure that all pods have more appropriate resource definitions, even when these are not explicitly specified in the manifests.
By default, we chose to apply per-container limits at namespace level. The configuration applied by default to all projects is the following:
kind: LimitRange
metadata:
name: default-limits-per-namespace
spec:
limits:
- default: # this section defines default limits
cpu: 500m
memory: 512Mi
defaultRequest: # this section defines default requests
cpu: 50m
memory: 128Mi
type: Container
With the defaultRequest and default settings for type: Container , a container that does not specify requests or limits is assigned 50m of CPU and 128Mi of memory as its request by default, and 500m of CPU and 512Mi of memory as its limit. This prevents limits from being treated as requests (when requests are not specified), reducing overallocation.
Applying a LimitRange to the namespace therefore ensures that every container has a minimum set of requested resources. This has several advantages, listed below.
- Preventing overallocation - If
requestsare omitted andlimitsare present, Kubernetes uses thelimitsasrequests. With a LimitRange, you can set a more realisticdefaultRequest, preventing an application that actually needs few resources from being scheduled as if it needed many. - System stability - Ensures that pods receive adequate resources to start and run, reducing
CrashLoopBackOfferrors or long startup times caused by insufficient resources, especially under heavy load. - Scheduling optimization - With default requests in place, the Kubernetes scheduler can make better-informed decisions about where to place pods, improving overall node utilization and reducing the number of idle nodes.
- Standardization - Helps keep configurations more consistent across workloads in the same namespace, simplifying management and debugging.
Implementing a LimitRange was therefore essential to give every workload the resources it needs to run correctly, without waste.
1.1.3. Optimizing the EC2 instance type
Another area of optimization concerned the choice of EC2 instances for the cluster nodes. Based on the detailed analysis of resource consumption, we determined that moving from the C family to the R family was the best option. We noticed, in fact, that many of our workloads used proportionally more RAM than CPU. The C (compute optimized) instances previously in use are optimized for CPU-intensive workloads. We therefore proposed migrating to R (memory optimized) instances, which offer a more favorable RAM-to-CPU ratio and better match our usage patterns. This change allowed us to host more pods per node, making the most of the available memory and reducing the total number of nodes required.
Together, these actions aim at a cluster with fewer nodes but a high density of running pods, making the best use of hardware resources and significantly reducing operating costs.
The results
We were able to configure a highly optimized cluster with a limited number of worker nodes that can run many pods simultaneously. This configuration is the result of careful resource calibration, in which we deliberately favored RAM over CPU compute power. The choice was driven by the specific nature of the workloads planned for this environment, which benefit more from ample RAM for I/O operations and in-memory data handling than from intensive CPU cycles. This approach allowed us to maximize efficiency and pod density per node, while keeping infrastructure costs low and the system highly responsive. The flexibility of this configuration also makes it possible to resize the cluster dynamically, scaling resources to the changing needs of our services and applications.
In addition, optimizing resource usage significantly reduced how often Karpenter had to scale the cluster. With more efficient, targeted resource management, node growth remained contained and under control, avoiding unexpected and costly expansion. This approach struck the right balance between performance and cost, ensuring that the cluster adapts dynamically to the workload without excessive waste.
Final recommendations
Including resource requests in every pod configuration on Kubernetes is essential. It is just as crucial, however, to make sure those requests are carefully calibrated and sufficient to cover the minimum needed for pods to start and run. Underestimating resources can cause serious disruptions, such as pods failing to start (stuck in the “Pending” or “CrashLoopBackOff” state) or slowing down significantly at startup, harming application availability and performance. We recommend thorough testing to determine the minimum CPU and memory requirements of each application before defining resource requests in the Kubernetes manifests.